StatPecker
StatPecker delivers fast AI-driven insights and stunning visuals from your data for effective business storytelling.
Visit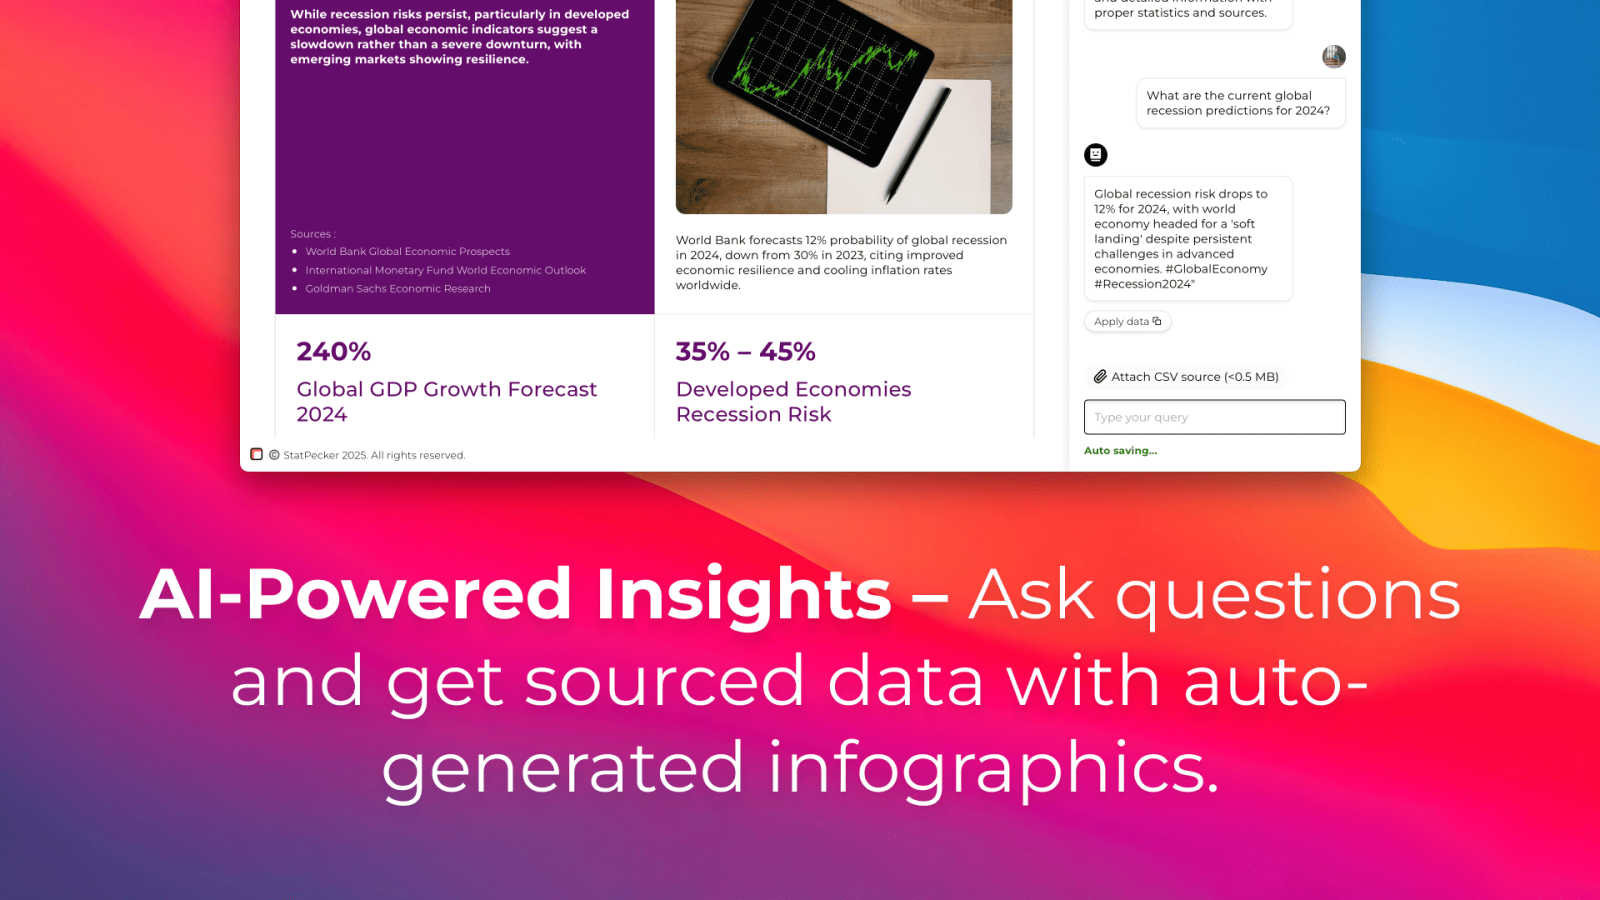
About StatPecker
StatPecker is an innovative AI-powered data visualization tool that transforms raw data into stunning, professional visuals within seconds. Designed to streamline the laborious process of data storytelling, it allows users to convert spreadsheets, CSV files, or simple queries into engaging infographics without needing design expertise. This tool is perfect for professionals across various fields, including content creators, journalists, data analysts, marketers, educators, and students. By automating the creation of visuals, StatPecker not only saves time and costs but also enhances the clarity and engagement of data communication. Users can focus on crafting compelling narratives and making informed decisions rather than getting bogged down in the complexities of chart creation. With StatPecker, advanced data visualization is no longer exclusive to specialists; it is accessible to everyone, empowering users to communicate insights effectively and visually.
Features of StatPecker
Ask Your Query
This feature allows users to gain instant insights from validated sources simply by asking questions. There is no need for complex tools or extensive data manipulation; users can easily request information and receive immediate, accurate responses.
Publish & Embed
With this feature, users can create interactive visuals that are seamlessly integrated into various platforms such as blogs, articles, and websites. This capability enhances the user’s ability to communicate data-driven insights effectively and attractively.
Upload & Analyze CSVs
StatPecker enables users to upload local CSV files, facilitating the extraction of key insights without the hassle of traditional spreadsheet software. This feature allows data analysis to be performed quickly and efficiently, streamlining the process of data visualization.
Download & Use Anywhere
Users can export their created infographics as images, making them easy to include in reports, presentations, and other formats. This flexibility ensures that users can utilize their visuals wherever needed, enhancing the overall impact of their data storytelling.
Use Cases of StatPecker
Content Creation
Content creators can use StatPecker to generate engaging infographics that visually represent data within their articles or blogs. This visual enhancement attracts readers' attention and improves comprehension of complex information.
Data Analysis
Data analysts can leverage StatPecker to quickly visualize trends and patterns from large datasets. By transforming raw data into actionable insights, analysts can present findings to stakeholders more effectively, facilitating informed decision-making.
Marketing Campaigns
Marketers can utilize StatPecker to create compelling visuals that illustrate campaign performance metrics. These infographics can be shared with teams and clients to highlight successes and areas for improvement, driving strategic discussions.
Education and Learning
Educators and students can benefit from StatPecker by creating informative visuals for presentations and assignments. This tool simplifies the process of conveying intricate concepts, making learning more engaging and enjoyable.
Frequently Asked Questions
How does StatPecker ensure data privacy?
StatPecker prioritizes user privacy by conducting all data analysis locally on the user's device. This means that your data stays secure and is not transmitted over the internet, ensuring confidentiality.
Can I use StatPecker for large datasets?
Yes, StatPecker supports CSV uploads of up to 50 MB, allowing users to analyze substantial datasets efficiently. This capability ensures that users can still extract meaningful insights from larger files.
Is there a free version of StatPecker available?
Absolutely! StatPecker offers a free tier that allows users to create unlimited projects and embeds, making it easy to get started with data visualization without any upfront cost.
What types of visuals can I create with StatPecker?
Users can create a wide variety of infographics, including charts, graphs, and interactive visuals. These can be tailored to suit different presentation styles and purposes, ensuring effective communication of data insights.
Explore more in this category:
Similar to StatPecker
Planning a relocation or long-term stay abroad? Compare places on sunshine, cost, tax, visa and stay duration, then ask AI about your shortlist.
Decision support framework for high consideration businesses with mix of online and offline channels, content-rich sites, and long customer journeys.
AI motion graphics and map animation generator for content creators, editors, founders and marketers.
Stop filming and editing, Reelry learns your brand from your website then ideates, scripts, and produces faceless TikToks in your style.
Get reliable social media data at scale with EnsembleData's real-time APIs for posts, profiles, and analytics.
Ribbi is a self-evolving AI agent that automates your entire social media workflow from content creation to performance tracking.