Dividend Data vs Prediction Pulse
Side-by-side comparison to help you choose the right product.
Dividend Data
Get instant stock data like dividends and financials directly in your Google Sheets or Excel spreadsheets.
Last updated: March 11, 2026
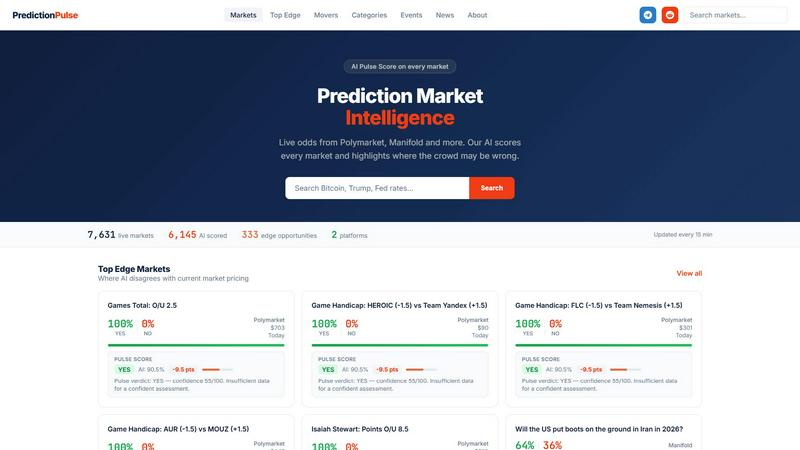
Prediction Pulse
Prediction Pulse leverages AI to analyze market trends and probabilities, helping you identify valuable insights and edge opportunities.
Last updated: March 18, 2026
Visual Comparison
Dividend Data

Prediction Pulse
Feature Comparison
Dividend Data
Comprehensive Spreadsheet Functions
Dividend Data provides 16 custom functions that cover every essential data point for fundamental analysis. Simply type formulas like =DIVIDENDDATA_DIVIDENDS("TICKER") to pull forward dividends, yields, and ex-dates, or use =DIVIDENDDATA_RATIOS() and =DIVIDENDDATA_METRICS() for valuation multiples and financial statement items. This turns your spreadsheet into a dynamic, auto-updating research dashboard, replacing hours of manual data collection with instant, reliable results.
Extensive Historical Data Library
Access over 30 years of historical market and financial data for a universe of 80,000+ global tickers. This deep history is crucial for conducting robust long-term analysis, calculating consistent dividend growth rates, assessing company performance through multiple market cycles, and building reliable financial models. The data is standardized and clean, ready for immediate use in your analysis.
Dual-Platform Compatibility
The tool works seamlessly in both Google Sheets and Microsoft Excel environments. Whether you collaborate in the cloud with Google Workspace or prefer the advanced capabilities of desktop Excel, you get the same consistent formulas and data quality. This flexibility ensures teams and individual investors can use their preferred platform without sacrificing functionality or data access.
AI-Powered Research Assistant
Available in the Pro Terminal, the AI Analyst acts as a dedicated research assistant. You can chat with it to screen for stocks based on custom criteria, get explanations of financial metrics, summarize company performance, and generate investment theses. This feature accelerates the initial research phase by providing instant, data-backed insights and answers to complex analytical questions.
Prediction Pulse
Comprehensive Market Aggregation
Prediction Pulse aggregates live odds from multiple prediction market platforms, including Polymarket and Manifold. This feature ensures that users have access to the most current and comprehensive market data, allowing for informed decision-making based on diverse market perspectives.
AI Pulse Score
The AI Pulse Score is a unique feature that scores every market based on its analysis of the underlying data. This score highlights where the crowd may be mispricing events, providing users with valuable insights and opportunities to capitalize on market inefficiencies.
Real-Time Updates
With updates occurring every 15 minutes, Prediction Pulse ensures that users receive the latest information on market movements. This real-time data is crucial for traders and researchers who need to act quickly in a dynamic environment where odds can shift rapidly.
Event Intelligence
Users can explore detailed event pages that offer a thorough breakdown of various prediction markets. This feature includes comparative analysis of probabilities across platforms and highlights significant trends, making it easier for users to understand the broader implications of market movements on specific events.
Use Cases
Dividend Data
Building a Dividend Growth Screener
Create a dynamic stock screener directly in your spreadsheet to identify companies that meet specific dividend investment criteria. Use functions to pull dividend yield, payout ratio, and 5-year dividend growth rate for thousands of stocks simultaneously. Filter and sort to find companies with a yield above 3%, a payout ratio below 60%, and consistent annual growth, all with data that updates automatically.
Automating Portfolio Tracking and Reporting
Manually updating a portfolio spreadsheet with current prices, dividend payments, and yield-on-cost is time-consuming. With Dividend Data, link your holdings using the ticker symbols. Formulas will automatically pull the latest price, dividend announcements, and ex-dates, giving you a real-time view of your portfolio's income, valuation, and performance without any manual input.
Conducting Deep Fundamental Valuation Analysis
Perform thorough company analysis by building a integrated model that pulls live data. Use functions to import years of income statement, balance sheet, and cash flow data directly into your discounted cash flow (DCF) or ratio analysis model. This allows you to test valuation scenarios with current and historical data, ensuring your analysis is based on the most accurate and recent figures available.
Preparing Investment Committee Reports
Quickly generate professional, data-rich reports for presentations or investment reviews. Instead of manually compiling charts and tables from multiple sources, use your spreadsheet with live Dividend Data links to create executive summaries showing key metrics, dividend histories, and peer comparisons. The data refreshes automatically, ensuring every report is based on the latest market information.
Prediction Pulse
Market Analysis for Traders
Traders can utilize Prediction Pulse to conduct in-depth market analysis, leveraging the AI Pulse Score to identify mispriced events. This capability allows them to make data-driven decisions that enhance their trading strategies and profitability.
Research and Academic Insights
Researchers can use the platform to study prediction markets and their implications on social, political, and economic events. The aggregated data and AI analysis provide a rich resource for academic research, fostering a deeper understanding of market behaviors and outcomes.
News Monitoring
With AI-generated news covering major movements in prediction markets, users can stay informed about the latest trends and shifts. This feature is particularly useful for investors and market analysts who need to track developments in real time.
Event Forecasting
Prediction Pulse is an invaluable tool for those interested in forecasting future events based on market sentiment. By analyzing aggregated data and AI predictions, users can gain insights into potential outcomes of significant global events, aiding in strategic planning and decision-making.
Overview
About Dividend Data
Dividend Data is a powerful financial data platform designed to eliminate the tedious manual work of stock research. It brings institutional-grade market data directly into the tools investors already use: Google Sheets and Microsoft Excel. The core product is a spreadsheet add-in that provides instant access to over 30 years of historical data for more than 80,000 tickers through simple, custom formulas. Built specifically for dividend and fundamental investors, it delivers critical metrics like dividend amounts, yields, payout ratios, growth rates, full financial statements, earnings, valuation ratios, and price history without requiring API keys, coding, or copying and pasting from unreliable sources. Its generous free tier offers 2,500 monthly credits with no trial expiration, making professional data accessible to everyone. The platform also includes a web-based Terminal for advanced visualizations, AI-powered research, and portfolio tracking. Ultimately, Dividend Data solves the problem of costly, complex data feeds by giving self-directed investors the comprehensive, accurate, and live data they need to make informed decisions, all within their familiar spreadsheet workflow.
About Prediction Pulse
Prediction Pulse is a cutting-edge AI-powered intelligence platform designed specifically for prediction markets. It integrates data from various platforms, including Polymarket and Manifold, aggregating thousands of live markets and organizing them into coherent real-world events. The core of Prediction Pulse lies in its proprietary Pulse Score probability engine, which employs advanced algorithms to analyze market data, estimate the most likely outcomes, and identify potential mispricing. This platform caters to traders, researchers, and anyone interested in gaining insights from prediction markets. With features that allow users to explore event pages, compare probabilities, and receive AI-generated news updates, Prediction Pulse provides a comprehensive understanding of market sentiment and anticipated future events, making it an invaluable tool for those looking to stay ahead in the fast-evolving world of prediction markets.
Frequently Asked Questions
Dividend Data FAQ
How does the free tier work?
The free tier provides 2,500 credits per month, which do not expire and renew each month. No credit card is required to start. Each data point retrieved by a formula (e.g., one cell with a price or a dividend yield) typically costs one credit. This allows for substantial usage for individual investors tracking a portfolio or analyzing a handful of stocks regularly.
What data can I access with the spreadsheet add-in?
You can access over 100 key metrics including dividend data (amount, yield, date, growth), real-time quotes, valuation ratios (P/E, P/B), profitability metrics, and full financial statement items (revenue, EPS, cash flow). The add-in also provides 30+ years of historical data for most of these metrics, enabling deep historical trend analysis.
Do I need to know how to code or use APIs?
Absolutely not. Dividend Data is designed for investors, not programmers. There is no need for API keys, scripting, or any coding knowledge. You simply install the add-in for Google Sheets or Excel and start using the plain-English custom formulas directly in your spreadsheet cells to pull data instantly.
Is my data secure and private?
Yes. Your spreadsheet data and queries remain private. Dividend Data operates as a read-only add-in; it does not collect, store, or have access to the contents of your spreadsheets or your portfolio holdings. It only receives the ticker symbols and metric names you explicitly request in your formulas to return the corresponding public market data.
Prediction Pulse FAQ
What is the Pulse Score and how does it work?
The Pulse Score is a proprietary metric used by Prediction Pulse to analyze market data and assess the likelihood of various outcomes. It highlights discrepancies between market pricing and AI-generated predictions, providing users with insights into potential opportunities.
How often is market data updated on Prediction Pulse?
Market data on Prediction Pulse is updated every 15 minutes, ensuring that users have access to the most current and relevant information. This frequent updating is essential for making informed trading decisions in a fast-paced environment.
Who can benefit from using Prediction Pulse?
Prediction Pulse is designed for a diverse audience, including traders, researchers, and enthusiasts of prediction markets. Its comprehensive features cater to anyone looking to gain insights into market behavior and anticipated future events.
Can I access data from multiple platforms on Prediction Pulse?
Yes, Prediction Pulse aggregates data from several prediction market platforms, including Polymarket and Manifold. This integration allows users to compare odds and insights across different sources, enhancing their overall analysis and decision-making.
Alternatives
Dividend Data Alternatives
Dividend Data is a specialized tool for fundamental and dividend investors, providing deep historical market data directly within spreadsheet platforms like Google Sheets and Excel. It falls into the category of financial data and analysis tools designed for individual investors and analysts. Users often explore alternatives for various reasons, such as budget constraints, the need for different data points, specific platform compatibility, or seeking a different pricing model like a one-time purchase versus a subscription. When evaluating other options, it's crucial to consider your core needs. Key factors include the depth and historical range of the financial data offered, the ease of integration with your existing workflow (especially within spreadsheets), the total cost relative to your usage, and whether the tool's features are built with a genuine understanding of fundamental and dividend investing strategies. The right solution should save you time and provide reliable data without unnecessary complexity.
Prediction Pulse Alternatives
Prediction Pulse is an AI-powered intelligence platform that specializes in prediction markets, aggregating data from various platforms such as Polymarket and Manifold. By utilizing a proprietary Pulse Score probability engine, it helps users understand market trends and probabilities related to real-world events. This makes it a valuable tool for traders, researchers, and anyone interested in the dynamics of future outcomes. However, users often seek alternatives to Prediction Pulse for various reasons, including pricing, specific feature sets, or compatibility with different platforms. When choosing an alternative, it's essential to consider factors like the accuracy of market analysis, the breadth of events covered, user experience, and the availability of tools that support informed decision-making. A well-rounded alternative should meet your unique needs while providing reliable insights into prediction markets.