Dividend Data vs GrowPanel
Side-by-side comparison to help you choose the right product.
Dividend Data
Get instant stock data like dividends and financials directly in your Google Sheets or Excel spreadsheets.
Last updated: March 11, 2026
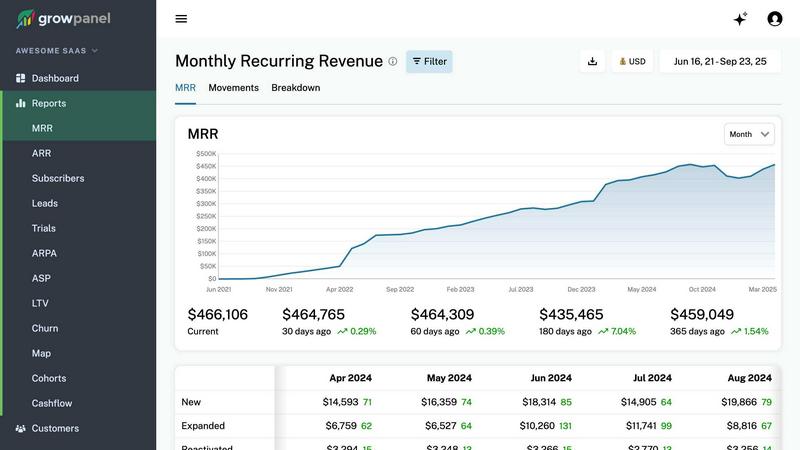
GrowPanel
GrowPanel delivers real-time SaaS metrics like MRR and churn, helping you make smarter business decisions effortlessly.
Last updated: February 26, 2026
Visual Comparison
Dividend Data

GrowPanel
Feature Comparison
Dividend Data
Comprehensive Spreadsheet Functions
Dividend Data provides 16 custom functions that cover every essential data point for fundamental analysis. Simply type formulas like =DIVIDENDDATA_DIVIDENDS("TICKER") to pull forward dividends, yields, and ex-dates, or use =DIVIDENDDATA_RATIOS() and =DIVIDENDDATA_METRICS() for valuation multiples and financial statement items. This turns your spreadsheet into a dynamic, auto-updating research dashboard, replacing hours of manual data collection with instant, reliable results.
Extensive Historical Data Library
Access over 30 years of historical market and financial data for a universe of 80,000+ global tickers. This deep history is crucial for conducting robust long-term analysis, calculating consistent dividend growth rates, assessing company performance through multiple market cycles, and building reliable financial models. The data is standardized and clean, ready for immediate use in your analysis.
Dual-Platform Compatibility
The tool works seamlessly in both Google Sheets and Microsoft Excel environments. Whether you collaborate in the cloud with Google Workspace or prefer the advanced capabilities of desktop Excel, you get the same consistent formulas and data quality. This flexibility ensures teams and individual investors can use their preferred platform without sacrificing functionality or data access.
AI-Powered Research Assistant
Available in the Pro Terminal, the AI Analyst acts as a dedicated research assistant. You can chat with it to screen for stocks based on custom criteria, get explanations of financial metrics, summarize company performance, and generate investment theses. This feature accelerates the initial research phase by providing instant, data-backed insights and answers to complex analytical questions.
GrowPanel
Real-time MRR, ARR, and Churn Tracking
GrowPanel offers real-time tracking of critical subscription metrics such as MRR, ARR, churn, and customer lifetime value (LTV). This feature allows you to monitor your financial health and performance metrics seamlessly, enabling quick decision-making based on up-to-date data.
Trial Conversion and Cohort Analysis
The platform provides detailed insights into trial user behavior, enabling you to identify conversion patterns and optimize your onboarding processes. With cohort analysis, you can track user retention and engagement over time, enhancing your ability to convert trials into paying subscribers.
Revenue Segmentation and Insights
With GrowPanel, you can segment your revenue data by various factors including plan type, geographical location, currency, and custom attributes. This feature allows for a deeper understanding of your revenue streams, helping you to tailor your strategies according to market demands and customer preferences.
AI Chat for Metrics Querying
GrowPanel features an AI chat interface that allows you to query your metrics using plain language. Instead of sifting through dashboards, you can simply ask questions like "What is our churn rate?" and receive instant, precise answers, significantly streamlining the data analysis process.
Use Cases
Dividend Data
Building a Dividend Growth Screener
Create a dynamic stock screener directly in your spreadsheet to identify companies that meet specific dividend investment criteria. Use functions to pull dividend yield, payout ratio, and 5-year dividend growth rate for thousands of stocks simultaneously. Filter and sort to find companies with a yield above 3%, a payout ratio below 60%, and consistent annual growth, all with data that updates automatically.
Automating Portfolio Tracking and Reporting
Manually updating a portfolio spreadsheet with current prices, dividend payments, and yield-on-cost is time-consuming. With Dividend Data, link your holdings using the ticker symbols. Formulas will automatically pull the latest price, dividend announcements, and ex-dates, giving you a real-time view of your portfolio's income, valuation, and performance without any manual input.
Conducting Deep Fundamental Valuation Analysis
Perform thorough company analysis by building a integrated model that pulls live data. Use functions to import years of income statement, balance sheet, and cash flow data directly into your discounted cash flow (DCF) or ratio analysis model. This allows you to test valuation scenarios with current and historical data, ensuring your analysis is based on the most accurate and recent figures available.
Preparing Investment Committee Reports
Quickly generate professional, data-rich reports for presentations or investment reviews. Instead of manually compiling charts and tables from multiple sources, use your spreadsheet with live Dividend Data links to create executive summaries showing key metrics, dividend histories, and peer comparisons. The data refreshes automatically, ensuring every report is based on the latest market information.
GrowPanel
Monitoring Subscription Metrics
SaaS businesses can use GrowPanel to effortlessly monitor their subscription metrics in real time. By connecting their billing platform, they can gain immediate insights into MRR, ARR, and churn rates, facilitating timely adjustments to their business strategies.
Enhancing Customer Retention
Companies can leverage GrowPanel's cohort analysis feature to understand customer behavior and retention patterns. By identifying trends in trial conversions and customer churn, businesses can implement targeted retention strategies to improve customer loyalty and reduce churn rates.
Optimizing Revenue Strategies
With revenue segmentation capabilities, businesses can analyze performance across different plans, regions, and currencies. This information enables them to refine their pricing strategies and target specific markets more effectively, driving revenue growth.
Streamlining Financial Reporting
GrowPanel simplifies financial reporting by offering cash flow insights that include fees, refunds, and taxes. This feature allows businesses to track all aspects of their revenue streams comprehensively, ensuring accuracy in financial planning and forecasting.
Overview
About Dividend Data
Dividend Data is a powerful financial data platform designed to eliminate the tedious manual work of stock research. It brings institutional-grade market data directly into the tools investors already use: Google Sheets and Microsoft Excel. The core product is a spreadsheet add-in that provides instant access to over 30 years of historical data for more than 80,000 tickers through simple, custom formulas. Built specifically for dividend and fundamental investors, it delivers critical metrics like dividend amounts, yields, payout ratios, growth rates, full financial statements, earnings, valuation ratios, and price history without requiring API keys, coding, or copying and pasting from unreliable sources. Its generous free tier offers 2,500 monthly credits with no trial expiration, making professional data accessible to everyone. The platform also includes a web-based Terminal for advanced visualizations, AI-powered research, and portfolio tracking. Ultimately, Dividend Data solves the problem of costly, complex data feeds by giving self-directed investors the comprehensive, accurate, and live data they need to make informed decisions, all within their familiar spreadsheet workflow.
About GrowPanel
GrowPanel is an innovative subscription analytics platform specifically designed for SaaS companies seeking clarity on their revenue metrics without the chaos of spreadsheets. By connecting your billing platform, whether it's Stripe, Chargebee, or Recurly, you can access instant dashboards that showcase key performance indicators such as Monthly Recurring Revenue (MRR), Annual Recurring Revenue (ARR), churn rates, retention metrics, expansion revenue, and cohort analysis, all updated in real-time. This platform is ideal for SaaS businesses that need to streamline their financial data, enhance visibility into their growth metrics, and make informed decisions that drive profitability. With a user-friendly interface and powerful insights, GrowPanel empowers businesses to gain a competitive edge in the fast-paced SaaS landscape.
Frequently Asked Questions
Dividend Data FAQ
How does the free tier work?
The free tier provides 2,500 credits per month, which do not expire and renew each month. No credit card is required to start. Each data point retrieved by a formula (e.g., one cell with a price or a dividend yield) typically costs one credit. This allows for substantial usage for individual investors tracking a portfolio or analyzing a handful of stocks regularly.
What data can I access with the spreadsheet add-in?
You can access over 100 key metrics including dividend data (amount, yield, date, growth), real-time quotes, valuation ratios (P/E, P/B), profitability metrics, and full financial statement items (revenue, EPS, cash flow). The add-in also provides 30+ years of historical data for most of these metrics, enabling deep historical trend analysis.
Do I need to know how to code or use APIs?
Absolutely not. Dividend Data is designed for investors, not programmers. There is no need for API keys, scripting, or any coding knowledge. You simply install the add-in for Google Sheets or Excel and start using the plain-English custom formulas directly in your spreadsheet cells to pull data instantly.
Is my data secure and private?
Yes. Your spreadsheet data and queries remain private. Dividend Data operates as a read-only add-in; it does not collect, store, or have access to the contents of your spreadsheets or your portfolio holdings. It only receives the ticker symbols and metric names you explicitly request in your formulas to return the corresponding public market data.
GrowPanel FAQ
How does GrowPanel ensure data accuracy?
GrowPanel connects directly with your billing platform, pulling real-time data to ensure that you have accurate and up-to-date insights into your financial metrics, which eliminates the potential for manual data entry errors.
Is GrowPanel compliant with GDPR?
Yes, GrowPanel is EU-hosted and fully compliant with GDPR regulations, ensuring that your data privacy and security are maintained according to European standards.
What platforms can I connect to GrowPanel?
GrowPanel allows you to connect with a variety of billing platforms including Stripe, Chargebee, Recurly, and many others. This flexibility makes it easy to integrate into your existing financial systems.
Can I access GrowPanel on mobile devices?
Absolutely! GrowPanel is designed to be mobile-friendly, allowing you to access your dashboards and reports on your smartphone, ensuring you can keep track of your metrics anytime, anywhere.
Alternatives
Dividend Data Alternatives
Dividend Data is a specialized tool for fundamental and dividend investors, providing deep historical market data directly within spreadsheet platforms like Google Sheets and Excel. It falls into the category of financial data and analysis tools designed for individual investors and analysts. Users often explore alternatives for various reasons, such as budget constraints, the need for different data points, specific platform compatibility, or seeking a different pricing model like a one-time purchase versus a subscription. When evaluating other options, it's crucial to consider your core needs. Key factors include the depth and historical range of the financial data offered, the ease of integration with your existing workflow (especially within spreadsheets), the total cost relative to your usage, and whether the tool's features are built with a genuine understanding of fundamental and dividend investing strategies. The right solution should save you time and provide reliable data without unnecessary complexity.
GrowPanel Alternatives
GrowPanel is a subscription analytics platform designed for SaaS companies seeking clarity on their revenue metrics without the confusion of spreadsheets. By providing real-time insights into metrics like MRR, churn, and LTV, it helps businesses make informed decisions rapidly. Users often seek alternatives to GrowPanel for reasons such as pricing models, specific feature sets, or compatibility with their existing platforms. When exploring alternatives, it is crucial to evaluate the ease of integration, the comprehensiveness of analytics offered, and the overall usability of the dashboard to ensure it meets your business needs.