Banknaked vs Dividend Data
Side-by-side comparison to help you choose the right product.

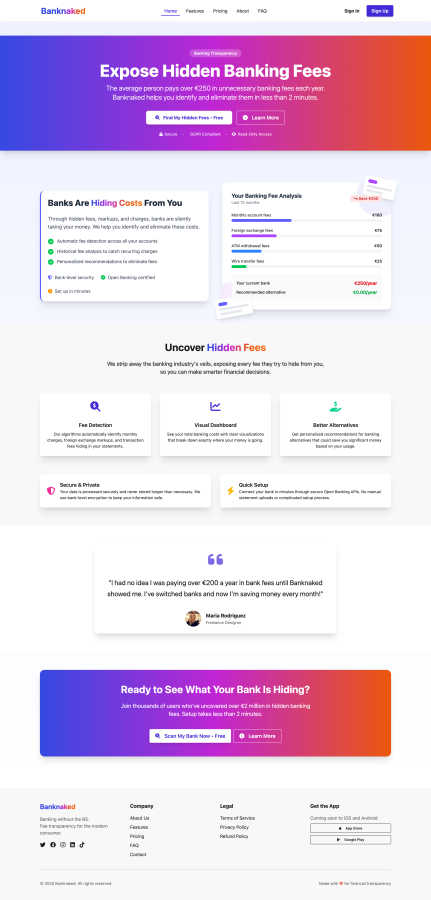
Banknaked
Banknaked finds and eliminates hidden bank fees in minutes to save you money.
Last updated: March 1, 2026
Dividend Data
Get instant stock data like dividends and financials directly in your Google Sheets or Excel spreadsheets.
Last updated: March 11, 2026
Visual Comparison
Banknaked
Dividend Data

Feature Comparison
Banknaked
Automated Fee Detection
Our advanced algorithms scan your connected bank accounts to automatically identify and categorize every charge. This includes recurring monthly account fees, foreign exchange markups on card transactions abroad, ATM withdrawal fees, and wire transfer costs. The system digs deep into your transaction history, ensuring no hidden fee, no matter how small or infrequent, goes unreported.
Visual Cost Dashboard
Gain immediate clarity with an intuitive visual dashboard that breaks down your total banking costs. See a clear pie chart or graph showing exactly where your money is going over the last 12 months. This transforms complex statement data into an easy-to-understand overview, allowing you to instantly grasp your biggest fee culprits and track changes over time.
Personalized Bank Recommendations
Based on your actual banking behavior and the fees you're incurring, Banknaked provides tailored recommendations for alternative banks or accounts. The system compares your usage patterns against market offerings to show you specific alternatives that could save you significant money, often highlighting options with zero monthly fees or better terms for your specific habits.
Secure, Read-Only Open Banking
Your security is paramount. Banknaked connects to your bank using secure, certified Open Banking APIs, which provide read-only access. This means we can see your transactions to analyze fees, but we cannot move, withdraw, or transfer any money. Your data is processed with bank-level encryption and is never stored longer than necessary, ensuring full GDPR compliance.
Dividend Data
Comprehensive Spreadsheet Functions
Dividend Data provides 16 custom functions that cover every essential data point for fundamental analysis. Simply type formulas like =DIVIDENDDATA_DIVIDENDS("TICKER") to pull forward dividends, yields, and ex-dates, or use =DIVIDENDDATA_RATIOS() and =DIVIDENDDATA_METRICS() for valuation multiples and financial statement items. This turns your spreadsheet into a dynamic, auto-updating research dashboard, replacing hours of manual data collection with instant, reliable results.
Extensive Historical Data Library
Access over 30 years of historical market and financial data for a universe of 80,000+ global tickers. This deep history is crucial for conducting robust long-term analysis, calculating consistent dividend growth rates, assessing company performance through multiple market cycles, and building reliable financial models. The data is standardized and clean, ready for immediate use in your analysis.
Dual-Platform Compatibility
The tool works seamlessly in both Google Sheets and Microsoft Excel environments. Whether you collaborate in the cloud with Google Workspace or prefer the advanced capabilities of desktop Excel, you get the same consistent formulas and data quality. This flexibility ensures teams and individual investors can use their preferred platform without sacrificing functionality or data access.
AI-Powered Research Assistant
Available in the Pro Terminal, the AI Analyst acts as a dedicated research assistant. You can chat with it to screen for stocks based on custom criteria, get explanations of financial metrics, summarize company performance, and generate investment theses. This feature accelerates the initial research phase by providing instant, data-backed insights and answers to complex analytical questions.
Use Cases
Banknaked
The Cost-Conscious Consumer
Individuals who want to optimize their personal finances and ensure they are not overpaying for basic banking services use Banknaked to get a definitive annual cost. By uncovering hundreds of euros in hidden fees, they can make an informed decision to switch to a cheaper bank or a no-fee digital account, putting that money back into their pocket.
Frequent Travelers
People who travel or make purchases in foreign currencies often incur substantial FX markups and international transaction fees without realizing it. Banknaked identifies these specific charges, allowing travelers to see the true cost of their spending abroad and switch to a bank or card specifically designed for travel with better exchange rates and lower fees.
Negotiating with Your Current Bank
Armed with a clear, data-driven report from Banknaked detailing all fees paid over the past year, customers can confidently contact their current bank's retention department. This evidence provides powerful leverage to negotiate for fee waivers, a better account package, or lower charges, turning insight into immediate savings without needing to switch providers.
Financial Review and Budgeting
As part of an annual financial health check, users connect Banknaked to get a complete picture of their administrative banking costs. This insight is integrated into their broader budgeting strategy, ensuring all recurring expenses are accounted for and minimized, leading to a more accurate and efficient personal financial plan.
Dividend Data
Building a Dividend Growth Screener
Create a dynamic stock screener directly in your spreadsheet to identify companies that meet specific dividend investment criteria. Use functions to pull dividend yield, payout ratio, and 5-year dividend growth rate for thousands of stocks simultaneously. Filter and sort to find companies with a yield above 3%, a payout ratio below 60%, and consistent annual growth, all with data that updates automatically.
Automating Portfolio Tracking and Reporting
Manually updating a portfolio spreadsheet with current prices, dividend payments, and yield-on-cost is time-consuming. With Dividend Data, link your holdings using the ticker symbols. Formulas will automatically pull the latest price, dividend announcements, and ex-dates, giving you a real-time view of your portfolio's income, valuation, and performance without any manual input.
Conducting Deep Fundamental Valuation Analysis
Perform thorough company analysis by building a integrated model that pulls live data. Use functions to import years of income statement, balance sheet, and cash flow data directly into your discounted cash flow (DCF) or ratio analysis model. This allows you to test valuation scenarios with current and historical data, ensuring your analysis is based on the most accurate and recent figures available.
Preparing Investment Committee Reports
Quickly generate professional, data-rich reports for presentations or investment reviews. Instead of manually compiling charts and tables from multiple sources, use your spreadsheet with live Dividend Data links to create executive summaries showing key metrics, dividend histories, and peer comparisons. The data refreshes automatically, ensuring every report is based on the latest market information.
Pricing Comparison
Banknaked
Banknaked offers a free tier that allows you to connect your bank and uncover your hidden fees. You can start using the service for free to get your initial fee analysis and see your potential savings. For ongoing monitoring, deeper historical analysis, and advanced features, premium upgrade options are available. You can delve deeper into managing your finances with these paid plans, which offer more comprehensive insights and tracking tools.
Dividend Data
Dividend Data operates on a credit-based system. It offers a permanent free tier with 2,500 monthly credits. Paid plans, which provide higher volumes of monthly credits, are available for users who require more extensive data access. Specific plan names, credit allowances, and monthly costs are detailed on the official Dividend Data pricing page, allowing users to scale their usage based on their individual or professional needs.
Overview
About Banknaked
Banknaked is a revolutionary financial transparency tool designed to expose the hidden costs that banks quietly deduct from your accounts. For the modern consumer, understanding the true cost of banking is often impossible, with fees buried in complex statements. Banknaked solves this by connecting securely to your bank accounts via Open Banking, providing a comprehensive, plain-language breakdown of all your charges. It automatically detects monthly maintenance fees, foreign exchange markups, ATM withdrawal costs, wire transfer fees, and other miscellaneous charges that typically go unnoticed. The platform is built with a strict privacy-first approach, using read-only access so your money is never touched and your data is encrypted. It’s tailored for anyone who wants to take definitive control of their finances, revealing exactly how much they spend on banking each year and offering actionable, personalized recommendations for cheaper alternatives. In just a few minutes, users can visualize their total fees, gain clear insights, and project annual costs, empowering them to switch providers, negotiate better terms, or eliminate unnecessary services altogether.
About Dividend Data
Dividend Data is a powerful financial data platform designed to eliminate the tedious manual work of stock research. It brings institutional-grade market data directly into the tools investors already use: Google Sheets and Microsoft Excel. The core product is a spreadsheet add-in that provides instant access to over 30 years of historical data for more than 80,000 tickers through simple, custom formulas. Built specifically for dividend and fundamental investors, it delivers critical metrics like dividend amounts, yields, payout ratios, growth rates, full financial statements, earnings, valuation ratios, and price history without requiring API keys, coding, or copying and pasting from unreliable sources. Its generous free tier offers 2,500 monthly credits with no trial expiration, making professional data accessible to everyone. The platform also includes a web-based Terminal for advanced visualizations, AI-powered research, and portfolio tracking. Ultimately, Dividend Data solves the problem of costly, complex data feeds by giving self-directed investors the comprehensive, accurate, and live data they need to make informed decisions, all within their familiar spreadsheet workflow.
Frequently Asked Questions
Banknaked FAQ
Is Banknaked safe to use?
Yes, Banknaked is extremely safe. We use secure, bank-certified Open Banking connections that are read-only, meaning we can never access your login credentials or move any money. Your data is encrypted, processed securely, and we adhere to strict GDPR guidelines, never storing your financial information longer than necessary for the analysis.
How much can I really save?
The average user discovers over €250 in unnecessary banking fees each year. Your actual savings depend on your current bank and financial habits. Banknaked provides a precise total of your fees and then recommends cheaper alternatives tailored to your usage, empowering you to eliminate those costs entirely or reduce them significantly.
Which banks are supported?
Banknaked supports all major banks and financial institutions that offer Open Banking connectivity. This covers a vast majority of banks across Europe and the UK. During the sign-up process, you can search for your bank to confirm connectivity. The setup is instant for supported banks, with no manual uploads required.
What is Open Banking?
Open Banking is a secure, regulated technology that allows you to give licensed applications (like Banknaked) permission to access your financial information directly from your bank, without sharing your login passwords. It uses strict standards and APIs to ensure your data is shared only with your explicit consent and is always protected.
Dividend Data FAQ
How does the free tier work?
The free tier provides 2,500 credits per month, which do not expire and renew each month. No credit card is required to start. Each data point retrieved by a formula (e.g., one cell with a price or a dividend yield) typically costs one credit. This allows for substantial usage for individual investors tracking a portfolio or analyzing a handful of stocks regularly.
What data can I access with the spreadsheet add-in?
You can access over 100 key metrics including dividend data (amount, yield, date, growth), real-time quotes, valuation ratios (P/E, P/B), profitability metrics, and full financial statement items (revenue, EPS, cash flow). The add-in also provides 30+ years of historical data for most of these metrics, enabling deep historical trend analysis.
Do I need to know how to code or use APIs?
Absolutely not. Dividend Data is designed for investors, not programmers. There is no need for API keys, scripting, or any coding knowledge. You simply install the add-in for Google Sheets or Excel and start using the plain-English custom formulas directly in your spreadsheet cells to pull data instantly.
Is my data secure and private?
Yes. Your spreadsheet data and queries remain private. Dividend Data operates as a read-only add-in; it does not collect, store, or have access to the contents of your spreadsheets or your portfolio holdings. It only receives the ticker symbols and metric names you explicitly request in your formulas to return the corresponding public market data.
Alternatives
Banknaked Alternatives
Banknaked is a personal finance tool that specializes in uncovering hidden bank fees. It falls into the category of financial transparency and money-saving apps, using secure connections to analyze your accounts and provide a clear picture of your banking costs. Users may look for alternatives for various reasons. Some might seek different pricing models, such as a one-time purchase versus a subscription. Others may need specific features, like integration with certain financial institutions, investment tracking, or a different user interface that better suits their platform preferences. When evaluating an alternative, focus on core capabilities. Ensure it offers robust, automatic fee detection and clear cost visualization. Strong data security with read-only access is non-negotiable. Finally, look for actionable insights, like personalized recommendations for cheaper accounts, to turn analysis into real savings.
Dividend Data Alternatives
Dividend Data is a specialized tool for fundamental and dividend investors, providing deep historical market data directly within spreadsheet platforms like Google Sheets and Excel. It falls into the category of financial data and analysis tools designed for individual investors and analysts. Users often explore alternatives for various reasons, such as budget constraints, the need for different data points, specific platform compatibility, or seeking a different pricing model like a one-time purchase versus a subscription. When evaluating other options, it's crucial to consider your core needs. Key factors include the depth and historical range of the financial data offered, the ease of integration with your existing workflow (especially within spreadsheets), the total cost relative to your usage, and whether the tool's features are built with a genuine understanding of fundamental and dividend investing strategies. The right solution should save you time and provide reliable data without unnecessary complexity.