echoloc vs StatPecker
Side-by-side comparison to help you choose the right product.
Echoloc uncovers buyer intent in job posts, enabling sales teams to target accounts ready to purchase.
Last updated: February 28, 2026

StatPecker
StatPecker delivers fast AI-driven insights and stunning visuals from your data for effective business storytelling.
Last updated: March 1, 2026
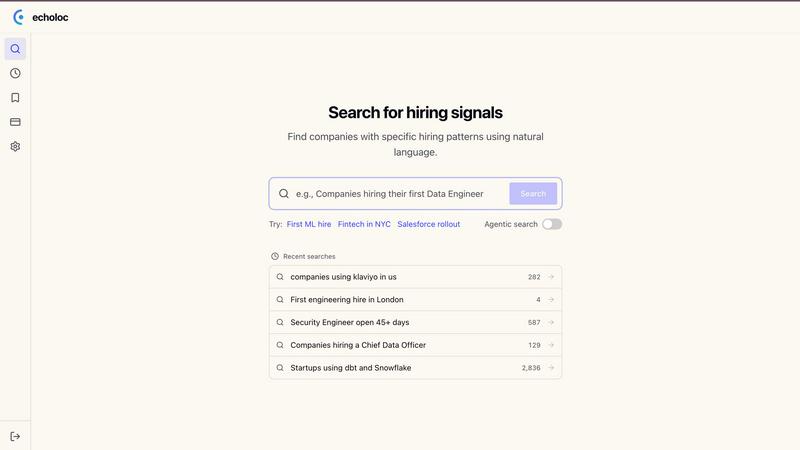
Visual Comparison
echoloc
StatPecker

Feature Comparison
echoloc
Real-Time Job Posting Analysis
Echoloc continuously analyzes over 10 million job postings and tracks more than 30 million companies, providing real-time updates on hiring signals. This feature ensures that users are always informed about the latest trends and opportunities in their target markets.
Evidence-Based Results
Every match generated by Echoloc includes relevant job post snippets, offering users clear proof of the hiring signals. This eliminates uncertainty and stale lists, allowing sales teams to make informed decisions based on accurate and up-to-date information.
Customizable Search Queries
Users can easily describe what they are looking for in plain English, without needing complex filters or training. This intuitive search capability allows sales professionals to quickly identify specific hiring signals, such as “companies hiring their first VP of Sales,” streamlining the prospecting process.
Comprehensive Hiring Signals Database
Echoloc’s database categorizes various hiring signals, including first hires, hiring spikes, urgent pain points, and geo expansions. This categorization allows sales teams to focus on the most relevant opportunities and tailor their outreach efforts accordingly.
StatPecker
Ask Your Query
This feature allows users to gain instant insights from validated sources simply by asking questions. There is no need for complex tools or extensive data manipulation; users can easily request information and receive immediate, accurate responses.
Publish & Embed
With this feature, users can create interactive visuals that are seamlessly integrated into various platforms such as blogs, articles, and websites. This capability enhances the user’s ability to communicate data-driven insights effectively and attractively.
Upload & Analyze CSVs
StatPecker enables users to upload local CSV files, facilitating the extraction of key insights without the hassle of traditional spreadsheet software. This feature allows data analysis to be performed quickly and efficiently, streamlining the process of data visualization.
Download & Use Anywhere
Users can export their created infographics as images, making them easy to include in reports, presentations, and other formats. This flexibility ensures that users can utilize their visuals wherever needed, enhancing the overall impact of their data storytelling.
Use Cases
echoloc
Early Identification of Growth Opportunities
Sales teams can use Echoloc to identify companies that are hiring key positions, such as a data engineer or a Chief Data Officer. This early identification enables them to approach these companies with tailored solutions that meet their evolving needs.
Targeting Companies in a Hiring Spike
Echoloc helps sales professionals pinpoint companies experiencing rapid hiring, such as startups looking to expand their engineering teams. This information allows sales teams to align their offerings with the urgent needs created by such hiring spikes.
Strategic Outreach for New Market Entries
By tracking companies that are hiring in new geographical regions, sales professionals can initiate conversations with new budget owners. This strategic outreach positions them as valuable partners for companies looking to establish a presence in new markets.
Addressing Urgent Pain Points
Sales teams can leverage Echoloc to identify companies with prolonged job openings, indicating hiring pain. Companies facing such challenges are often more willing to invest in solutions that can alleviate their hiring struggles, making them prime targets for outreach.
StatPecker
Content Creation
Content creators can use StatPecker to generate engaging infographics that visually represent data within their articles or blogs. This visual enhancement attracts readers' attention and improves comprehension of complex information.
Data Analysis
Data analysts can leverage StatPecker to quickly visualize trends and patterns from large datasets. By transforming raw data into actionable insights, analysts can present findings to stakeholders more effectively, facilitating informed decision-making.
Marketing Campaigns
Marketers can utilize StatPecker to create compelling visuals that illustrate campaign performance metrics. These infographics can be shared with teams and clients to highlight successes and areas for improvement, driving strategic discussions.
Education and Learning
Educators and students can benefit from StatPecker by creating informative visuals for presentations and assignments. This tool simplifies the process of conveying intricate concepts, making learning more engaging and enjoyable.
Overview
About echoloc
Echoloc is an innovative platform that revolutionizes the way sales professionals identify and engage potential buyers by tapping into job postings as a source of actionable insights. Unlike traditional intent data providers, Echoloc analyzes millions of job postings to uncover hidden buying signals that suggest when companies are gearing up to invest in new technologies or services. This data-driven approach empowers sales development representatives (SDRs), account executives (AEs), and revenue teams to discover valuable opportunities ahead of the competition. For instance, when a company advertises for its first data engineer or expands its sales team, it signals a growth phase and a probable increase in spending. Echoloc equips sales professionals with concrete evidence from job descriptions, facilitating informed and timely outreach. By catching buyer intent before it becomes mainstream, teams can enhance their targeting strategies and gain a competitive edge in the market.
About StatPecker
StatPecker is an innovative AI-powered data visualization tool that transforms raw data into stunning, professional visuals within seconds. Designed to streamline the laborious process of data storytelling, it allows users to convert spreadsheets, CSV files, or simple queries into engaging infographics without needing design expertise. This tool is perfect for professionals across various fields, including content creators, journalists, data analysts, marketers, educators, and students. By automating the creation of visuals, StatPecker not only saves time and costs but also enhances the clarity and engagement of data communication. Users can focus on crafting compelling narratives and making informed decisions rather than getting bogged down in the complexities of chart creation. With StatPecker, advanced data visualization is no longer exclusive to specialists; it is accessible to everyone, empowering users to communicate insights effectively and visually.
Frequently Asked Questions
echoloc FAQ
How does Echoloc gather and analyze job postings?
Echoloc utilizes advanced algorithms to analyze millions of job postings across various industries, identifying patterns and signals that indicate potential buying intent. This data is continuously updated to ensure real-time accuracy.
Can I customize my search queries?
Yes, Echoloc allows users to input search queries in plain English, making it easy to find specific hiring signals without the need for complex filters or extensive training.
What types of hiring signals can I track?
Echoloc categorizes hiring signals into various types, including first hires, hiring spikes, urgent pain points, and geo expansions, enabling users to focus on the most relevant opportunities.
Is there a trial period available for new users?
Echoloc offers a demo for potential users to explore the platform's capabilities. For specific trial periods or pricing details, it is best to sign up for an account and check the latest offers on the Echoloc website.
StatPecker FAQ
How does StatPecker ensure data privacy?
StatPecker prioritizes user privacy by conducting all data analysis locally on the user's device. This means that your data stays secure and is not transmitted over the internet, ensuring confidentiality.
Can I use StatPecker for large datasets?
Yes, StatPecker supports CSV uploads of up to 50 MB, allowing users to analyze substantial datasets efficiently. This capability ensures that users can still extract meaningful insights from larger files.
Is there a free version of StatPecker available?
Absolutely! StatPecker offers a free tier that allows users to create unlimited projects and embeds, making it easy to get started with data visualization without any upfront cost.
What types of visuals can I create with StatPecker?
Users can create a wide variety of infographics, including charts, graphs, and interactive visuals. These can be tailored to suit different presentation styles and purposes, ensuring effective communication of data insights.
Alternatives
echoloc Alternatives
Echoloc is an innovative platform designed to help sales professionals identify buying signals in job postings, making it easier for them to target accounts that are likely to make purchases. This tool falls under the Business & Finance category and is specifically tailored for sales development representatives, account executives, and revenue teams. Users often seek alternatives to Echoloc for various reasons, including budget constraints, specific feature requirements, or compatibility with existing platforms. When selecting an alternative, it’s essential to consider factors such as the comprehensiveness of data analysis, ease of use, integration capabilities, and the ability to provide actionable insights for timely engagement with potential buyers.
StatPecker Alternatives
StatPecker is an AI-powered data visualization tool that streamlines the process of transforming raw data into compelling visuals. It fits within the analytics and data category, providing businesses with quick insights and stunning infographics from their datasets. Users often seek alternatives to StatPecker for various reasons, including pricing structures, specific feature sets, or compatibility with different platforms. When choosing an alternative, it’s essential to consider factors such as ease of use, the flexibility of data integration, the quality of visual outputs, and the overall value it brings to your data storytelling needs.