Dividend Data vs Redbark
Side-by-side comparison to help you choose the right product.
Dividend Data
Get instant stock data like dividends and financials directly in your Google Sheets or Excel spreadsheets.
Last updated: March 11, 2026
Effortlessly sync your Australian bank and brokerage data to Google Sheets and YNAB with real-time updates and no.
Last updated: March 4, 2026
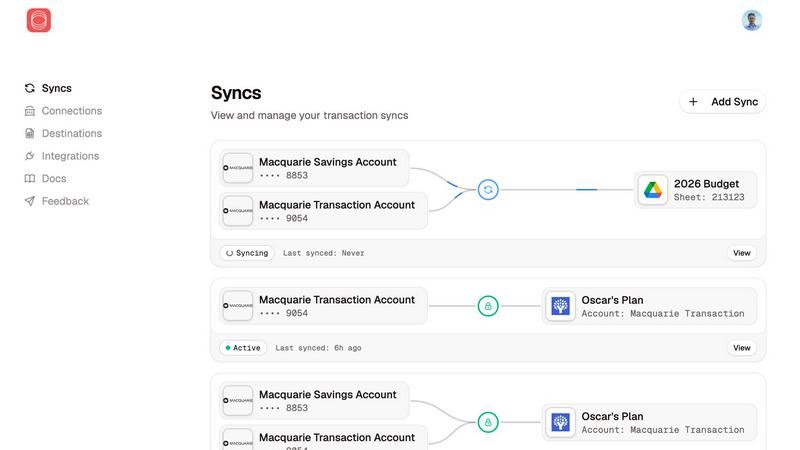
Visual Comparison
Dividend Data

Redbark
Feature Comparison
Dividend Data
Comprehensive Spreadsheet Functions
Dividend Data provides 16 custom functions that cover every essential data point for fundamental analysis. Simply type formulas like =DIVIDENDDATA_DIVIDENDS("TICKER") to pull forward dividends, yields, and ex-dates, or use =DIVIDENDDATA_RATIOS() and =DIVIDENDDATA_METRICS() for valuation multiples and financial statement items. This turns your spreadsheet into a dynamic, auto-updating research dashboard, replacing hours of manual data collection with instant, reliable results.
Extensive Historical Data Library
Access over 30 years of historical market and financial data for a universe of 80,000+ global tickers. This deep history is crucial for conducting robust long-term analysis, calculating consistent dividend growth rates, assessing company performance through multiple market cycles, and building reliable financial models. The data is standardized and clean, ready for immediate use in your analysis.
Dual-Platform Compatibility
The tool works seamlessly in both Google Sheets and Microsoft Excel environments. Whether you collaborate in the cloud with Google Workspace or prefer the advanced capabilities of desktop Excel, you get the same consistent formulas and data quality. This flexibility ensures teams and individual investors can use their preferred platform without sacrificing functionality or data access.
AI-Powered Research Assistant
Available in the Pro Terminal, the AI Analyst acts as a dedicated research assistant. You can chat with it to screen for stocks based on custom criteria, get explanations of financial metrics, summarize company performance, and generate investment theses. This feature accelerates the initial research phase by providing instant, data-backed insights and answers to complex analytical questions.
Redbark
Automated Data Syncing
Redbark allows users to connect their Australian bank accounts and automatically sync transactions to tools like Google Sheets and YNAB. This feature eliminates the need for manual exports and reduces the risk of human error.
Secure Data Handling
Utilizing the CDR framework, Redbark ensures that your financial data is handled securely and in compliance with Australian regulations. It employs AES-256 encryption and maintains a pass-through architecture, meaning your data is never stored on their servers.
Multi-Account Support
Users can sync multiple accounts, including savings, transaction, credit cards, and loans, each to its own destination. This flexibility allows for tailored financial tracking and reporting, catering to individual needs.
Smart Deduplication
Redbark's intelligent deduplication feature prevents duplicate transactions from cluttering your data. This is achieved through ID-based deduplication with overlap buffers, ensuring accurate records without the hassle of manual clean-up.
Use Cases
Dividend Data
Building a Dividend Growth Screener
Create a dynamic stock screener directly in your spreadsheet to identify companies that meet specific dividend investment criteria. Use functions to pull dividend yield, payout ratio, and 5-year dividend growth rate for thousands of stocks simultaneously. Filter and sort to find companies with a yield above 3%, a payout ratio below 60%, and consistent annual growth, all with data that updates automatically.
Automating Portfolio Tracking and Reporting
Manually updating a portfolio spreadsheet with current prices, dividend payments, and yield-on-cost is time-consuming. With Dividend Data, link your holdings using the ticker symbols. Formulas will automatically pull the latest price, dividend announcements, and ex-dates, giving you a real-time view of your portfolio's income, valuation, and performance without any manual input.
Conducting Deep Fundamental Valuation Analysis
Perform thorough company analysis by building a integrated model that pulls live data. Use functions to import years of income statement, balance sheet, and cash flow data directly into your discounted cash flow (DCF) or ratio analysis model. This allows you to test valuation scenarios with current and historical data, ensuring your analysis is based on the most accurate and recent figures available.
Preparing Investment Committee Reports
Quickly generate professional, data-rich reports for presentations or investment reviews. Instead of manually compiling charts and tables from multiple sources, use your spreadsheet with live Dividend Data links to create executive summaries showing key metrics, dividend histories, and peer comparisons. The data refreshes automatically, ensuring every report is based on the latest market information.
Redbark
Freelancers Managing Invoices
Freelancers can leverage Redbark to track their invoices and expenses effortlessly. By syncing bank transactions directly to their preferred financial tools, they can maintain accurate records without the hassle of manual entry.
Investors Monitoring Portfolios
For investors, Redbark provides a streamlined way to monitor portfolios across various brokerages. By automating the data flow, investors can focus on analyzing their investments rather than spending time on data entry.
Small Business Owners Tracking Cash Flow
Small business owners can benefit from Redbark by automating cash flow tracking. With real-time updates and no manual exports, they can make informed financial decisions quickly and accurately.
Individuals Seeking Financial Insights
Anyone looking to gain better insights into their finances can utilize Redbark's features. By connecting various accounts and syncing data to familiar tools, users can achieve a comprehensive view of their financial health effortlessly.
Overview
About Dividend Data
Dividend Data is a powerful financial data platform designed to eliminate the tedious manual work of stock research. It brings institutional-grade market data directly into the tools investors already use: Google Sheets and Microsoft Excel. The core product is a spreadsheet add-in that provides instant access to over 30 years of historical data for more than 80,000 tickers through simple, custom formulas. Built specifically for dividend and fundamental investors, it delivers critical metrics like dividend amounts, yields, payout ratios, growth rates, full financial statements, earnings, valuation ratios, and price history without requiring API keys, coding, or copying and pasting from unreliable sources. Its generous free tier offers 2,500 monthly credits with no trial expiration, making professional data accessible to everyone. The platform also includes a web-based Terminal for advanced visualizations, AI-powered research, and portfolio tracking. Ultimately, Dividend Data solves the problem of costly, complex data feeds by giving self-directed investors the comprehensive, accurate, and live data they need to make informed decisions, all within their familiar spreadsheet workflow.
About Redbark
Redbark is an innovative financial data management tool designed to simplify the way you connect and interact with your financial accounts. It serves as a secure bridge between your Australian bank accounts and global investment portfolios, enabling seamless integration with productivity tools like Google Sheets, Notion, and Airtable. By eliminating the cumbersome process of manual data entry and the risks associated with outdated screen-scraping methods, Redbark streamlines your financial tracking. Utilizing Australia's Consumer Data Right (CDR) framework, it ensures bank-approved and secure access to your transaction, balance, and investment holding data. Your information syncs automatically on a schedule you control, flowing directly from your financial institution to your selected destination without being stored on Redbark's servers. Designed for freelancers, investors, small business owners, and anyone seeking a clear view of their finances, Redbark prioritizes simplicity and privacy. With easy setup and support for a wide range of banks and brokerages, Redbark is your go-to solution for automated financial management.
Frequently Asked Questions
Dividend Data FAQ
How does the free tier work?
The free tier provides 2,500 credits per month, which do not expire and renew each month. No credit card is required to start. Each data point retrieved by a formula (e.g., one cell with a price or a dividend yield) typically costs one credit. This allows for substantial usage for individual investors tracking a portfolio or analyzing a handful of stocks regularly.
What data can I access with the spreadsheet add-in?
You can access over 100 key metrics including dividend data (amount, yield, date, growth), real-time quotes, valuation ratios (P/E, P/B), profitability metrics, and full financial statement items (revenue, EPS, cash flow). The add-in also provides 30+ years of historical data for most of these metrics, enabling deep historical trend analysis.
Do I need to know how to code or use APIs?
Absolutely not. Dividend Data is designed for investors, not programmers. There is no need for API keys, scripting, or any coding knowledge. You simply install the add-in for Google Sheets or Excel and start using the plain-English custom formulas directly in your spreadsheet cells to pull data instantly.
Is my data secure and private?
Yes. Your spreadsheet data and queries remain private. Dividend Data operates as a read-only add-in; it does not collect, store, or have access to the contents of your spreadsheets or your portfolio holdings. It only receives the ticker symbols and metric names you explicitly request in your formulas to return the corresponding public market data.
Redbark FAQ
How does Redbark ensure the security of my financial data?
Redbark employs a pass-through architecture and AES-256 encryption to secure your data. It adheres to the CDR framework, ensuring that your financial information is never stored on their servers.
What types of accounts can I connect with Redbark?
Redbark supports connections to a variety of Australian bank accounts, credit unions, and global brokerages through its integration with the CDR framework and other services like SnapTrade.
Is there a coding requirement to set up Redbark?
No, setting up Redbark is designed to be user-friendly and requires no coding knowledge. Users can connect their accounts and select destinations in just a few simple steps.
Can I sync multiple bank accounts to different destinations?
Yes, Redbark allows you to sync multiple accounts, such as savings, transaction, and credit accounts, to different destinations simultaneously, providing flexibility in how your financial data is organized.
Alternatives
Dividend Data Alternatives
Dividend Data is a specialized tool for fundamental and dividend investors, providing deep historical market data directly within spreadsheet platforms like Google Sheets and Excel. It falls into the category of financial data and analysis tools designed for individual investors and analysts. Users often explore alternatives for various reasons, such as budget constraints, the need for different data points, specific platform compatibility, or seeking a different pricing model like a one-time purchase versus a subscription. When evaluating other options, it's crucial to consider your core needs. Key factors include the depth and historical range of the financial data offered, the ease of integration with your existing workflow (especially within spreadsheets), the total cost relative to your usage, and whether the tool's features are built with a genuine understanding of fundamental and dividend investing strategies. The right solution should save you time and provide reliable data without unnecessary complexity.
Redbark Alternatives
Redbark is an innovative financial data synchronization tool designed to connect Australian bank accounts and global brokerage information to popular productivity applications like Google Sheets and YNAB. It falls under the categories of Business & Finance and Personal Finance, streamlining the management of financial data through automatic syncing and secure access. Users often seek alternatives to Redbark for various reasons, including pricing considerations, specific feature requirements, and compatibility with other platforms. When choosing an alternative, it's essential to evaluate aspects such as data security, ease of use, integration capabilities, and the range of supported financial institutions to ensure it meets your individual needs and enhances your financial management experience.