GrowPanel vs StatPecker
Side-by-side comparison to help you choose the right product.
GrowPanel
GrowPanel delivers real-time SaaS metrics like MRR and churn, helping you make smarter business decisions effortlessly.
Last updated: February 26, 2026

StatPecker
StatPecker delivers fast AI-driven insights and stunning visuals from your data for effective business storytelling.
Last updated: March 1, 2026
Visual Comparison
GrowPanel
StatPecker
Feature Comparison
GrowPanel
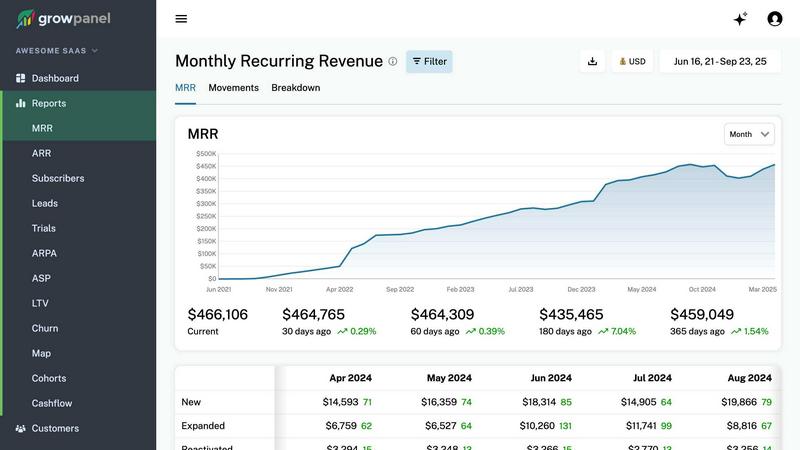
Real-time MRR, ARR, and Churn Tracking
GrowPanel offers real-time tracking of critical subscription metrics such as MRR, ARR, churn, and customer lifetime value (LTV). This feature allows you to monitor your financial health and performance metrics seamlessly, enabling quick decision-making based on up-to-date data.
Trial Conversion and Cohort Analysis
The platform provides detailed insights into trial user behavior, enabling you to identify conversion patterns and optimize your onboarding processes. With cohort analysis, you can track user retention and engagement over time, enhancing your ability to convert trials into paying subscribers.
Revenue Segmentation and Insights
With GrowPanel, you can segment your revenue data by various factors including plan type, geographical location, currency, and custom attributes. This feature allows for a deeper understanding of your revenue streams, helping you to tailor your strategies according to market demands and customer preferences.
AI Chat for Metrics Querying
GrowPanel features an AI chat interface that allows you to query your metrics using plain language. Instead of sifting through dashboards, you can simply ask questions like "What is our churn rate?" and receive instant, precise answers, significantly streamlining the data analysis process.
StatPecker
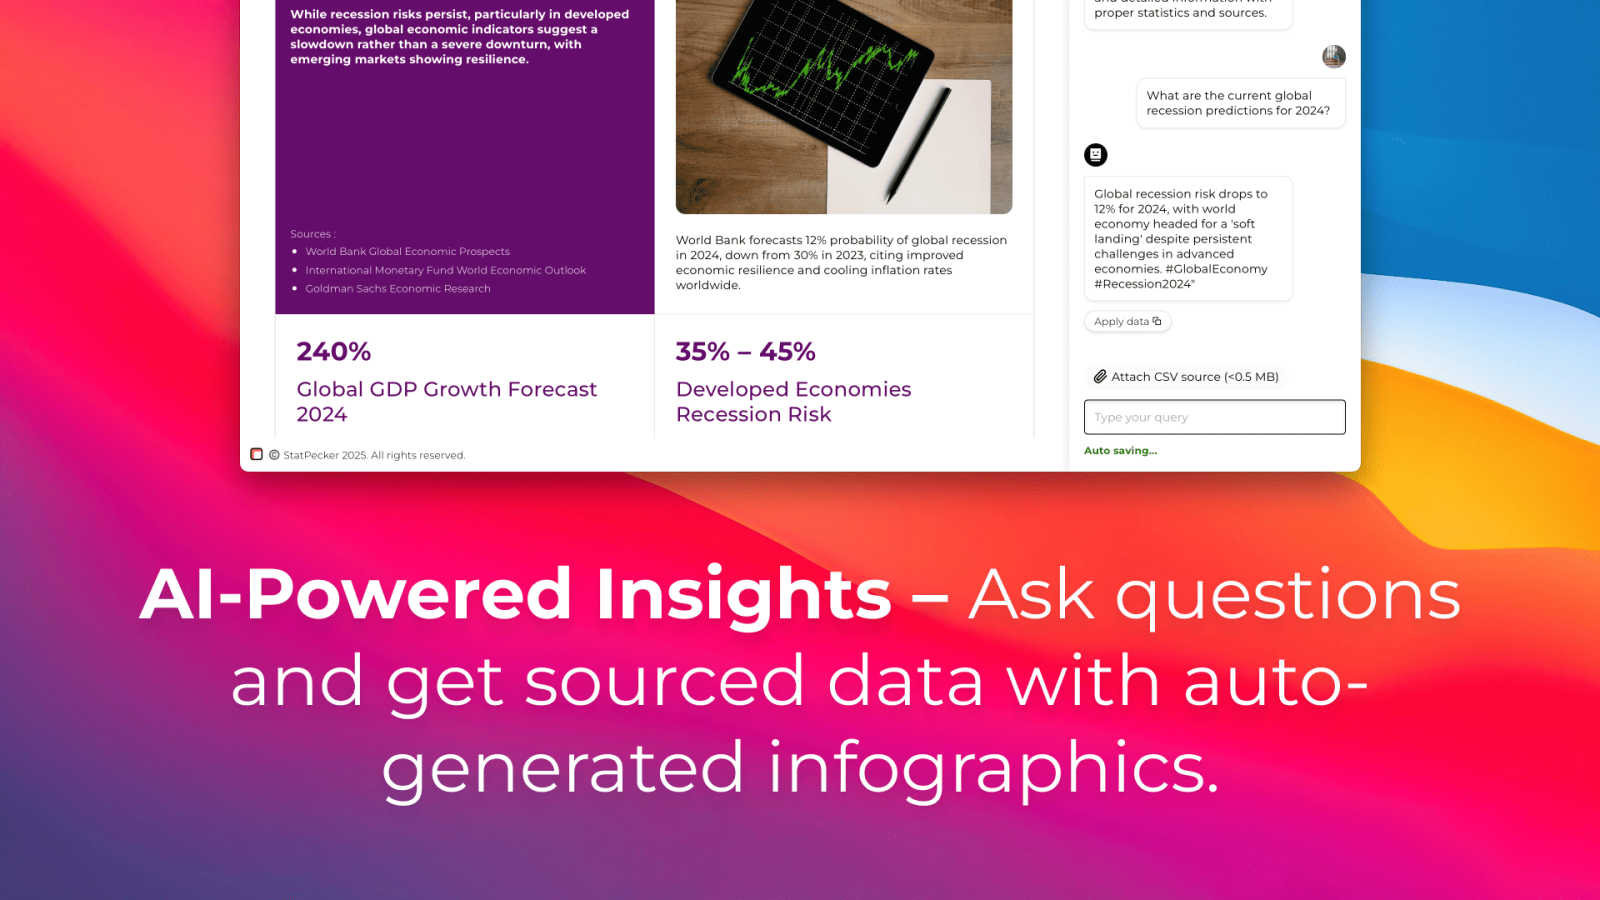
Ask Your Query
This feature allows users to gain instant insights from validated sources simply by asking questions. There is no need for complex tools or extensive data manipulation; users can easily request information and receive immediate, accurate responses.
Publish & Embed
With this feature, users can create interactive visuals that are seamlessly integrated into various platforms such as blogs, articles, and websites. This capability enhances the user’s ability to communicate data-driven insights effectively and attractively.
Upload & Analyze CSVs
StatPecker enables users to upload local CSV files, facilitating the extraction of key insights without the hassle of traditional spreadsheet software. This feature allows data analysis to be performed quickly and efficiently, streamlining the process of data visualization.
Download & Use Anywhere
Users can export their created infographics as images, making them easy to include in reports, presentations, and other formats. This flexibility ensures that users can utilize their visuals wherever needed, enhancing the overall impact of their data storytelling.
Use Cases
GrowPanel
Monitoring Subscription Metrics
SaaS businesses can use GrowPanel to effortlessly monitor their subscription metrics in real time. By connecting their billing platform, they can gain immediate insights into MRR, ARR, and churn rates, facilitating timely adjustments to their business strategies.
Enhancing Customer Retention
Companies can leverage GrowPanel's cohort analysis feature to understand customer behavior and retention patterns. By identifying trends in trial conversions and customer churn, businesses can implement targeted retention strategies to improve customer loyalty and reduce churn rates.
Optimizing Revenue Strategies
With revenue segmentation capabilities, businesses can analyze performance across different plans, regions, and currencies. This information enables them to refine their pricing strategies and target specific markets more effectively, driving revenue growth.
Streamlining Financial Reporting
GrowPanel simplifies financial reporting by offering cash flow insights that include fees, refunds, and taxes. This feature allows businesses to track all aspects of their revenue streams comprehensively, ensuring accuracy in financial planning and forecasting.
StatPecker
Content Creation
Content creators can use StatPecker to generate engaging infographics that visually represent data within their articles or blogs. This visual enhancement attracts readers' attention and improves comprehension of complex information.
Data Analysis
Data analysts can leverage StatPecker to quickly visualize trends and patterns from large datasets. By transforming raw data into actionable insights, analysts can present findings to stakeholders more effectively, facilitating informed decision-making.
Marketing Campaigns
Marketers can utilize StatPecker to create compelling visuals that illustrate campaign performance metrics. These infographics can be shared with teams and clients to highlight successes and areas for improvement, driving strategic discussions.
Education and Learning
Educators and students can benefit from StatPecker by creating informative visuals for presentations and assignments. This tool simplifies the process of conveying intricate concepts, making learning more engaging and enjoyable.
Overview
About GrowPanel
GrowPanel is an innovative subscription analytics platform specifically designed for SaaS companies seeking clarity on their revenue metrics without the chaos of spreadsheets. By connecting your billing platform, whether it's Stripe, Chargebee, or Recurly, you can access instant dashboards that showcase key performance indicators such as Monthly Recurring Revenue (MRR), Annual Recurring Revenue (ARR), churn rates, retention metrics, expansion revenue, and cohort analysis, all updated in real-time. This platform is ideal for SaaS businesses that need to streamline their financial data, enhance visibility into their growth metrics, and make informed decisions that drive profitability. With a user-friendly interface and powerful insights, GrowPanel empowers businesses to gain a competitive edge in the fast-paced SaaS landscape.
About StatPecker
StatPecker is an innovative AI-powered data visualization tool that transforms raw data into stunning, professional visuals within seconds. Designed to streamline the laborious process of data storytelling, it allows users to convert spreadsheets, CSV files, or simple queries into engaging infographics without needing design expertise. This tool is perfect for professionals across various fields, including content creators, journalists, data analysts, marketers, educators, and students. By automating the creation of visuals, StatPecker not only saves time and costs but also enhances the clarity and engagement of data communication. Users can focus on crafting compelling narratives and making informed decisions rather than getting bogged down in the complexities of chart creation. With StatPecker, advanced data visualization is no longer exclusive to specialists; it is accessible to everyone, empowering users to communicate insights effectively and visually.
Frequently Asked Questions
GrowPanel FAQ
How does GrowPanel ensure data accuracy?
GrowPanel connects directly with your billing platform, pulling real-time data to ensure that you have accurate and up-to-date insights into your financial metrics, which eliminates the potential for manual data entry errors.
Is GrowPanel compliant with GDPR?
Yes, GrowPanel is EU-hosted and fully compliant with GDPR regulations, ensuring that your data privacy and security are maintained according to European standards.
What platforms can I connect to GrowPanel?
GrowPanel allows you to connect with a variety of billing platforms including Stripe, Chargebee, Recurly, and many others. This flexibility makes it easy to integrate into your existing financial systems.
Can I access GrowPanel on mobile devices?
Absolutely! GrowPanel is designed to be mobile-friendly, allowing you to access your dashboards and reports on your smartphone, ensuring you can keep track of your metrics anytime, anywhere.
StatPecker FAQ
How does StatPecker ensure data privacy?
StatPecker prioritizes user privacy by conducting all data analysis locally on the user's device. This means that your data stays secure and is not transmitted over the internet, ensuring confidentiality.
Can I use StatPecker for large datasets?
Yes, StatPecker supports CSV uploads of up to 50 MB, allowing users to analyze substantial datasets efficiently. This capability ensures that users can still extract meaningful insights from larger files.
Is there a free version of StatPecker available?
Absolutely! StatPecker offers a free tier that allows users to create unlimited projects and embeds, making it easy to get started with data visualization without any upfront cost.
What types of visuals can I create with StatPecker?
Users can create a wide variety of infographics, including charts, graphs, and interactive visuals. These can be tailored to suit different presentation styles and purposes, ensuring effective communication of data insights.
Alternatives
GrowPanel Alternatives
GrowPanel is a subscription analytics platform designed for SaaS companies seeking clarity on their revenue metrics without the confusion of spreadsheets. By providing real-time insights into metrics like MRR, churn, and LTV, it helps businesses make informed decisions rapidly. Users often seek alternatives to GrowPanel for reasons such as pricing models, specific feature sets, or compatibility with their existing platforms. When exploring alternatives, it is crucial to evaluate the ease of integration, the comprehensiveness of analytics offered, and the overall usability of the dashboard to ensure it meets your business needs.
StatPecker Alternatives
StatPecker is an AI-powered data visualization tool that streamlines the process of transforming raw data into compelling visuals. It fits within the analytics and data category, providing businesses with quick insights and stunning infographics from their datasets. Users often seek alternatives to StatPecker for various reasons, including pricing structures, specific feature sets, or compatibility with different platforms. When choosing an alternative, it’s essential to consider factors such as ease of use, the flexibility of data integration, the quality of visual outputs, and the overall value it brings to your data storytelling needs.