AECharts
AECharts is an intuitive animated chart maker that turns your data into stunning videos and images with customizable templates and easy exports.
Visit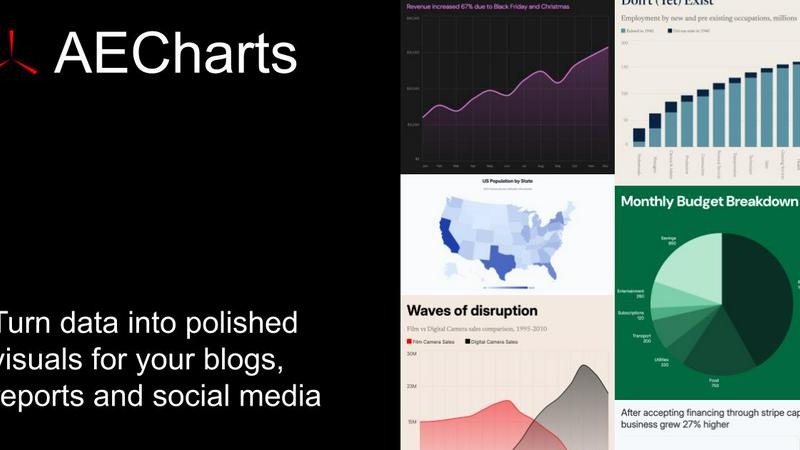
About AECharts
AECharts is an innovative browser-based tool designed for creating animated chart videos without the need for extensive design skills or software installations. It empowers users to transform raw data into visually appealing animated videos within minutes. By simply uploading a spreadsheet, pasting data, or connecting to a Google Sheet, anyone can generate professional-quality videos featuring a variety of chart types such as bar charts, line charts, and pie charts. AECharts is particularly beneficial for educators, marketers, analysts, and businesses looking to enhance their presentations and social media content. Its main value proposition lies in its ability to simplify the data visualization process, making animated charts accessible and easy to produce, thereby increasing engagement and communication effectiveness.
Features of AECharts
Animated Chart Creation
Every chart created in AECharts is automatically an animated video, eliminating the need for additional video editing tools. This feature allows users to focus on data presentation rather than technical complexities, ensuring quick and efficient creation.
Customizable Templates
AECharts offers a variety of professional templates that can be customized to fit your brand identity. Users can easily adjust colors, fonts, and logos, ensuring that every chart aligns with their branding strategy and visual style.
Flexible Export Options
Users can export their animated charts in multiple formats, including MP4 for videos and JPEG or PNG for images. This flexibility allows for seamless integration with various platforms such as PowerPoint, Google Slides, and social media, catering to a wide range of presentation needs.
Diverse Chart Types
AECharts supports a growing selection of chart types, currently featuring 14 distinct options including bar charts, line charts, pie charts, and bar chart races. This variety enables users to select the most effective visualization method for their data, enhancing clarity and impact.
Use Cases of AECharts
Educational Presentations
Educators can use AECharts to create engaging animated charts that effectively communicate complex data concepts to students. This tool makes learning interactive and visually stimulating, improving student comprehension and retention.
Marketing Campaigns
Marketers can leverage AECharts to produce captivating animated videos that showcase campaign performance metrics or product comparisons. These dynamic visuals are more likely to grab attention on social media, driving higher engagement rates.
Business Reports
Businesses can enhance their internal and external reports with animated charts that summarize data trends and insights. By presenting data in an engaging format, AECharts helps stakeholders quickly grasp key information.
Data Storytelling
Data analysts and storytellers can use AECharts to craft compelling narratives around their data. By animating charts, they can guide viewers through complex datasets, making the information more relatable and easier to understand.
Frequently Asked Questions
What is AECharts?
AECharts is a browser-based tool that allows users to create animated charts and videos using various data sources, making data visualization straightforward and accessible.
Who is this tool designed for?
AECharts is designed for a diverse audience including educators, marketers, business professionals, and analysts who need to present data in an engaging manner without requiring advanced technical skills.
Do I need coding or design skills to use it?
No, AECharts is user-friendly and does not require any coding or design skills. Its intuitive interface allows anyone to create animated charts easily.
Can I import data from CSV or spreadsheets?
Yes, AECharts allows users to upload data directly from CSV files, Excel spreadsheets, or Google Sheets, making it convenient to work with existing data.
Similar to AECharts
Kirkify AI instantly transforms any photo into viral Charlie Kirk memes with advanced face swap technology for creators and marketers.
Stop juggling separate AI tools; MagicShot AI generates photos, videos, and voice clips from a single upload to solve all your visual content needs.
CustomTattoo AI turns your tattoo ideas into realistic on-skin previews so you can confidently bring clear, artist-ready concepts to your next.
Inkfox AI generates unlimited images for free with no sign-up, turning prompts into ads, product shots, and social visuals instantly.
Receiptum allows you to quickly create fully customizable and professional receipts for any purpose, no design skills required.
Pixeliser is a free, client-side tool that instantly pixelizes images to protect privacy or create pixel art, all while ensuring confidentiality.
Stop struggling with pixel art and generate game-ready sprites from text descriptions in seconds with Sprite-AI.
Generate photorealistic images with accurate text and precise edits using GPT Image 2, all for free.